Info
These are the results from the NeoVAD Blade Profile Definition
The output of the blade profile fitting functions was verified by plotting the blade angle, β, against the length, M.
Note
The angles were modified to align with the Ansys BladeGen convention.
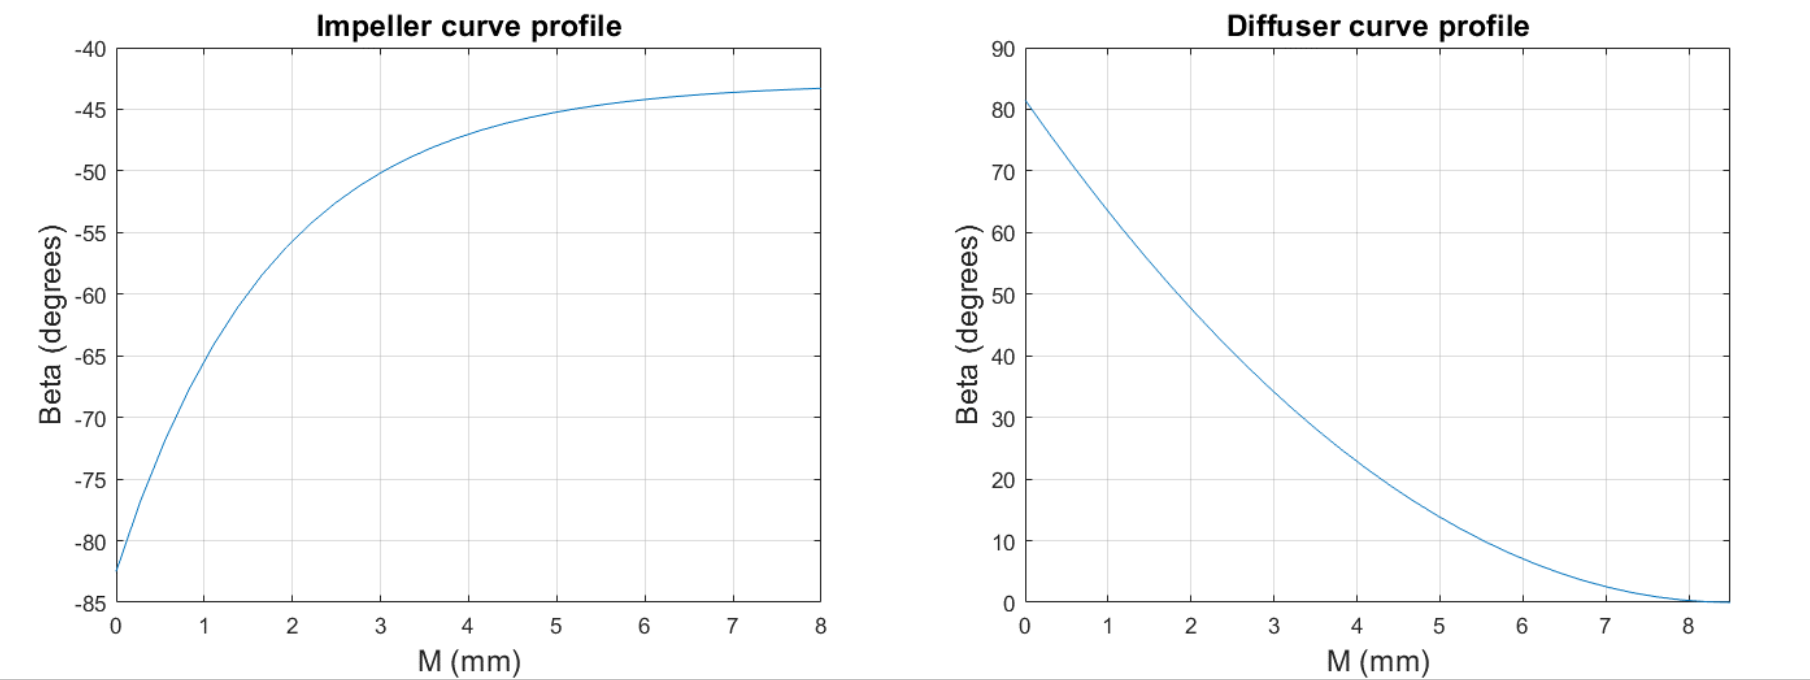 Blade angle fitting for the impeller (left) and diffuser (right) for the control experiment.
The program successfully provided a smooth fit between the desired input and output angles for both the impeller and the diffuser. It was tested for various cases, including the bounds of the angles defined for the DoE, to verify its reliability. Furthermore, the function detected if the wrap angle of the blade was over 360 degrees (one full rotation) and subsequently displayed a warning. It was also an output of the function.
The method of fitting the blade angles may have had a small effect on the simulation; an alternative method of fitting is to use circular arcs for the blades. Although this was not investigated as part of the project, the fitting method was an isolated function that could be modified relatively easily.
One reason why the exponential fit was chosen was because a high β value forces a high gradient as per . An exponential fit allowed the angle to be steep at the inlet, then quickly drop to a lower value to prevent the blade from wrapping excessively. By doing this, the flow interacted with the required inlet and outlet angles.
The quadratic fit used for the diffuser did not allow for this, however, the outlet angle for the diffuser was always 0. This means the risk of overwrapping was substantially lower for the diffuser and was not an issue for most of the experiments.
The data points were successfully written to the .bgi file and imported into BladeGen to generate the blade diagrams. The diagrams were verified both visually, and by plotting the blade angle and wrap angle against the blade length in Ansys
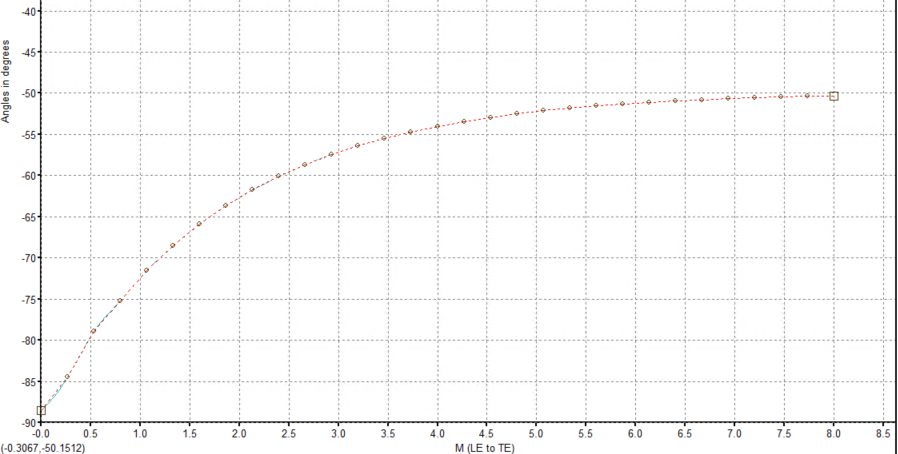 A plot of blade angle vs length from Ansys BladeGen for the initial impeller geometry.
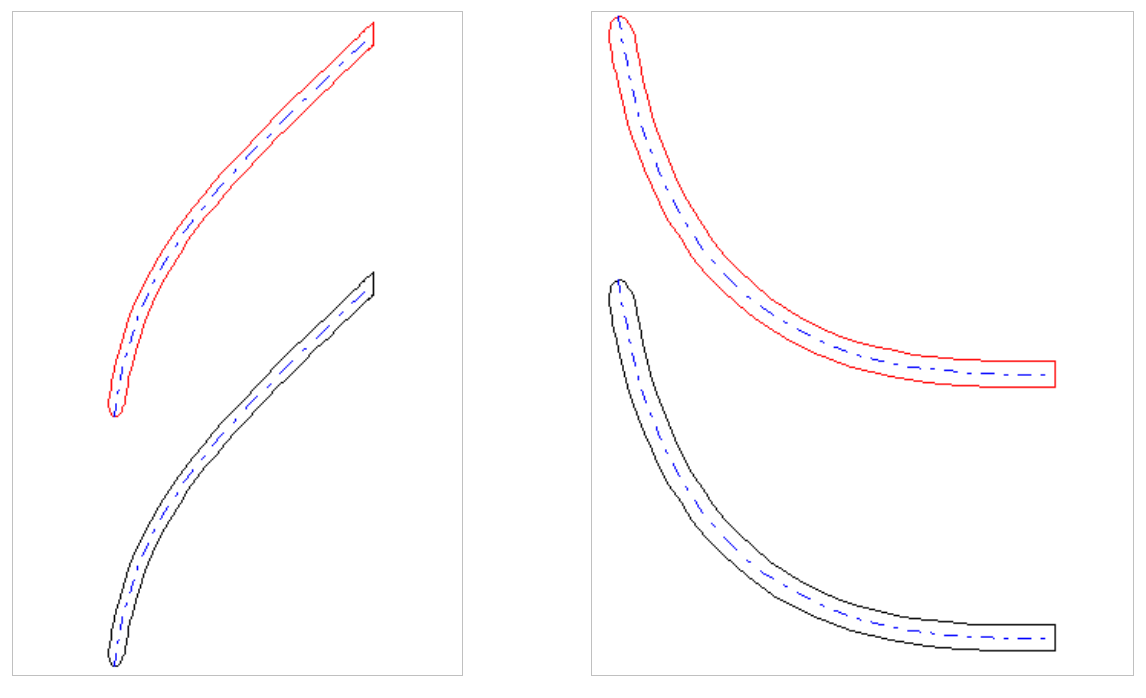 The blade diagrams viewed in BladeGen for the impeller (right) and diffuser (left).
Similarly, the coordinates of the meridional profile were verified manually. Each point was viewed individually and compared with the expected values inputted into the Python script. This was tested for each of the experiments conducted for the sensitivity analysis, and the first three experiments defined by the DoE. It was assumed to be correct for all subsequent experiments which were run automatically.
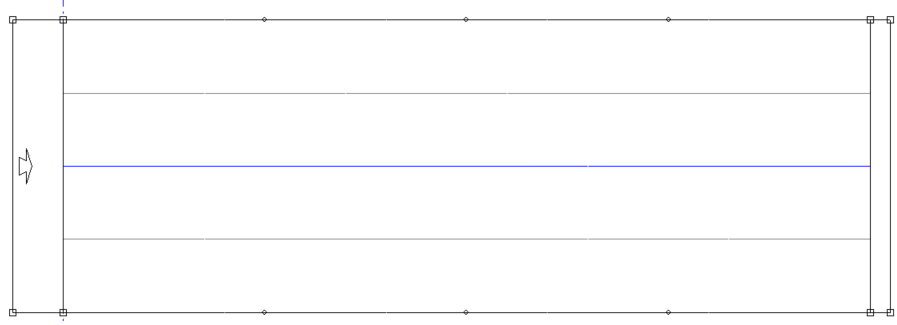 The meridional profile for the impeller