Info
These are the results from the NeoVAD Sensitivity Analysis
The impeller outlet angle (β2) caused a 37% change in pressure compared with the control, which was the largest change of all the parameters. This was followed by the diffuser length. All other parameters caused a difference of less than 5%.
| Experiment number | Changed parameter | Pressure increase (mmHg) | Percentage change (%) |
|---|---|---|---|
| Control | N/A | 60.3 | N/A |
| 1 | β1 | 60.5 | +0.35 |
| 2 | β2 | 37.8 | -37 |
| 3 | α2 | 62.8 | +4.1 |
| 4 | L1 | 59.7 | -0.92 |
| 5 | L2 | 48.5 | -19.6 |
Impeller outlet angle effect
The impeller outlet angle had a direct impact on the flow entering the diffuser. The outlet angle was sharper relative to the diffuser inlet angle, and the flow was highly misaligned between the impeller and diffuser. This may have caused the large reduction in pressure head, as the flow was not effectively propagated.
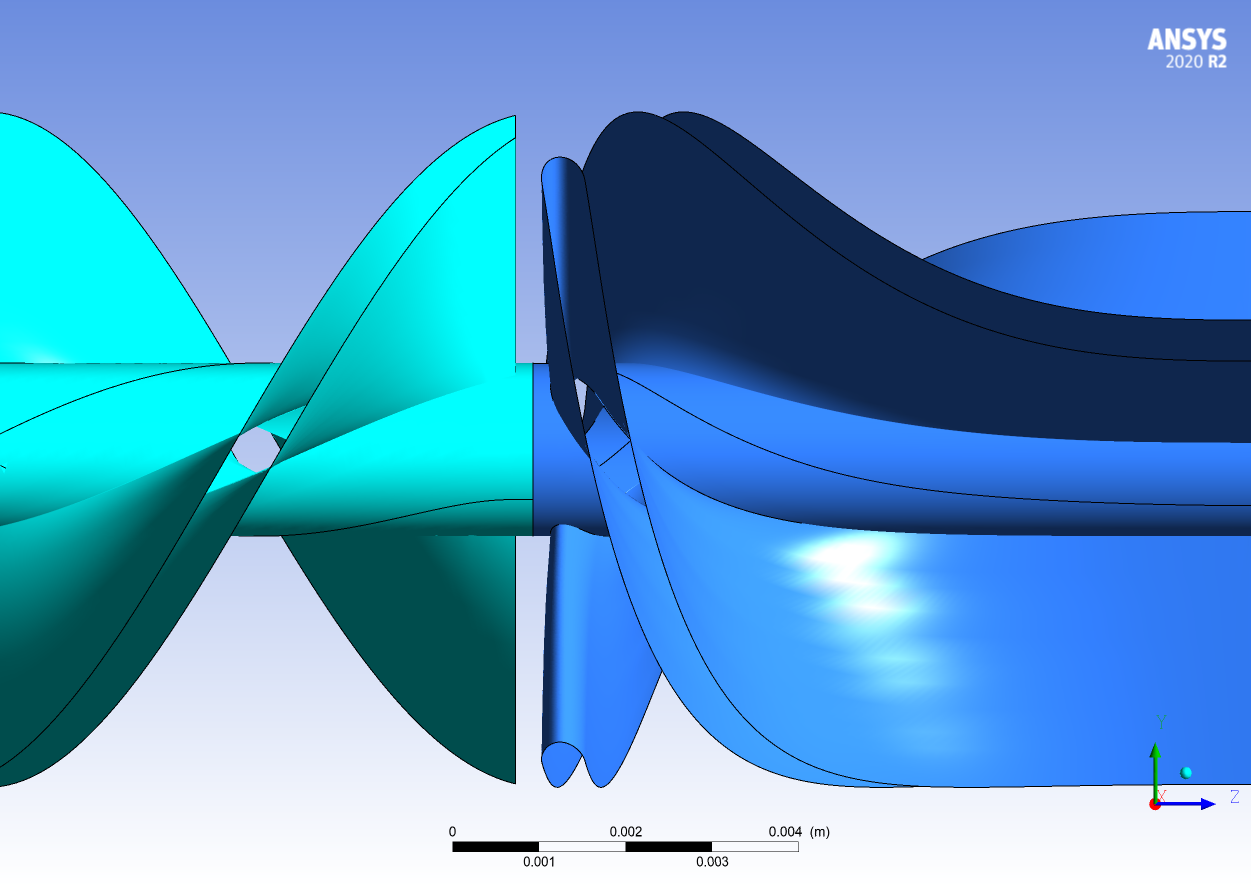
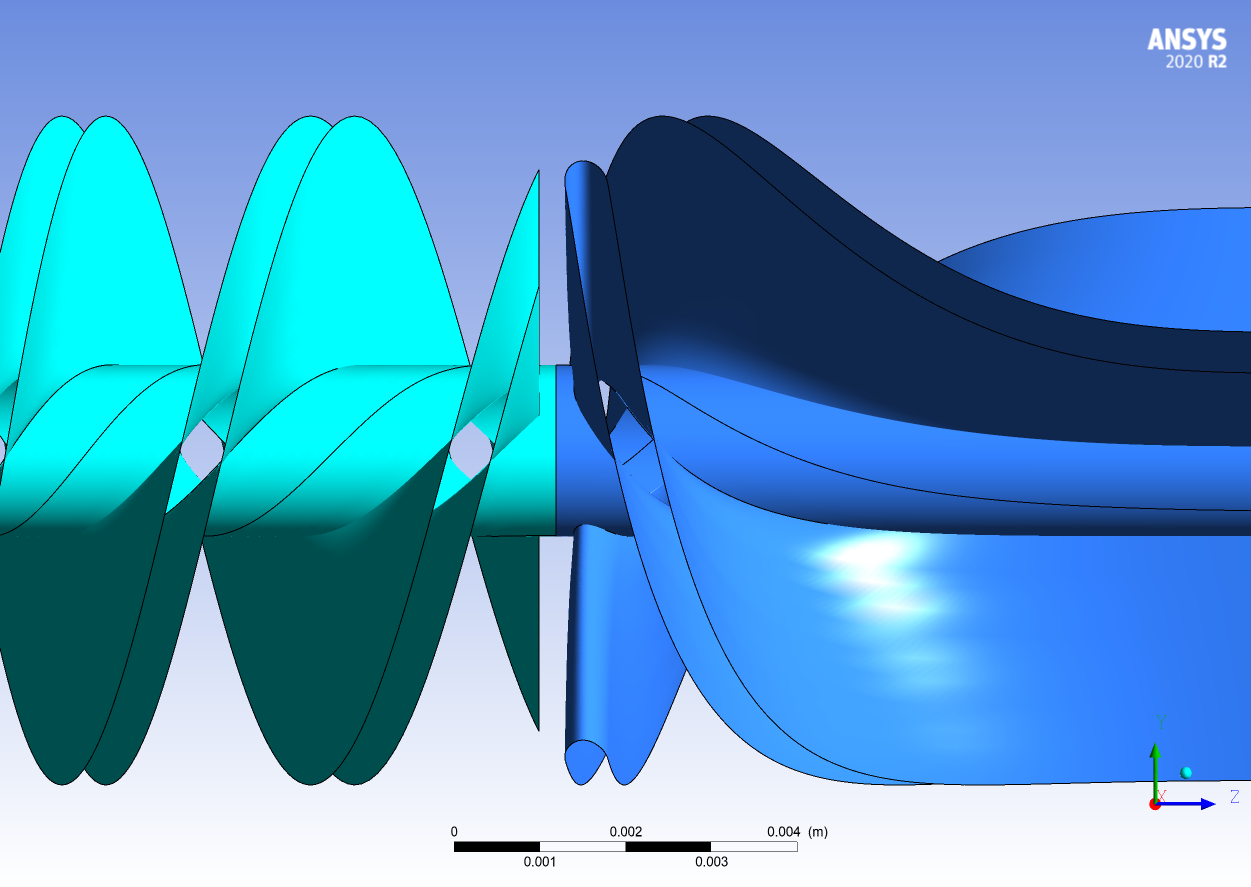 The view of the impeller and diffuser for the control (top) and experiment 2 (bottom) of the sensitivity analysis.
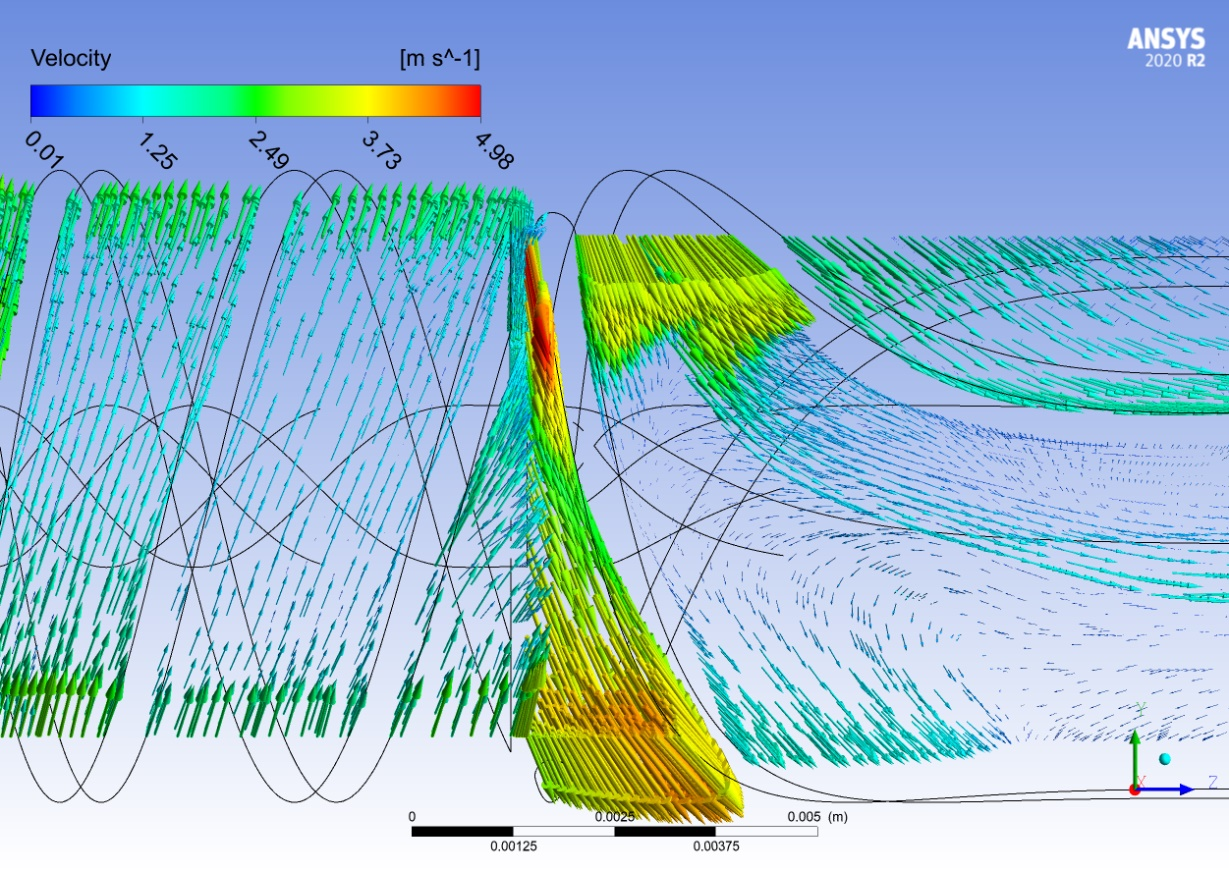 Velocity vector field for experiment 2 of the sensitivity analysis.
Diffuser length effect
Similarly, a velocity field plot was produced to investigate the effect of diffuser length on the pressure as per experiment number 5. The flow was well aligned near the inlet but as the flow travelled along the diffuser length, vortices started to appear. This was most prevalent near the outlet where a portion of the flow was drawn back in. Increasing the diffuser length likely amplified this effect causing a reduction in the overall pressure head increase.
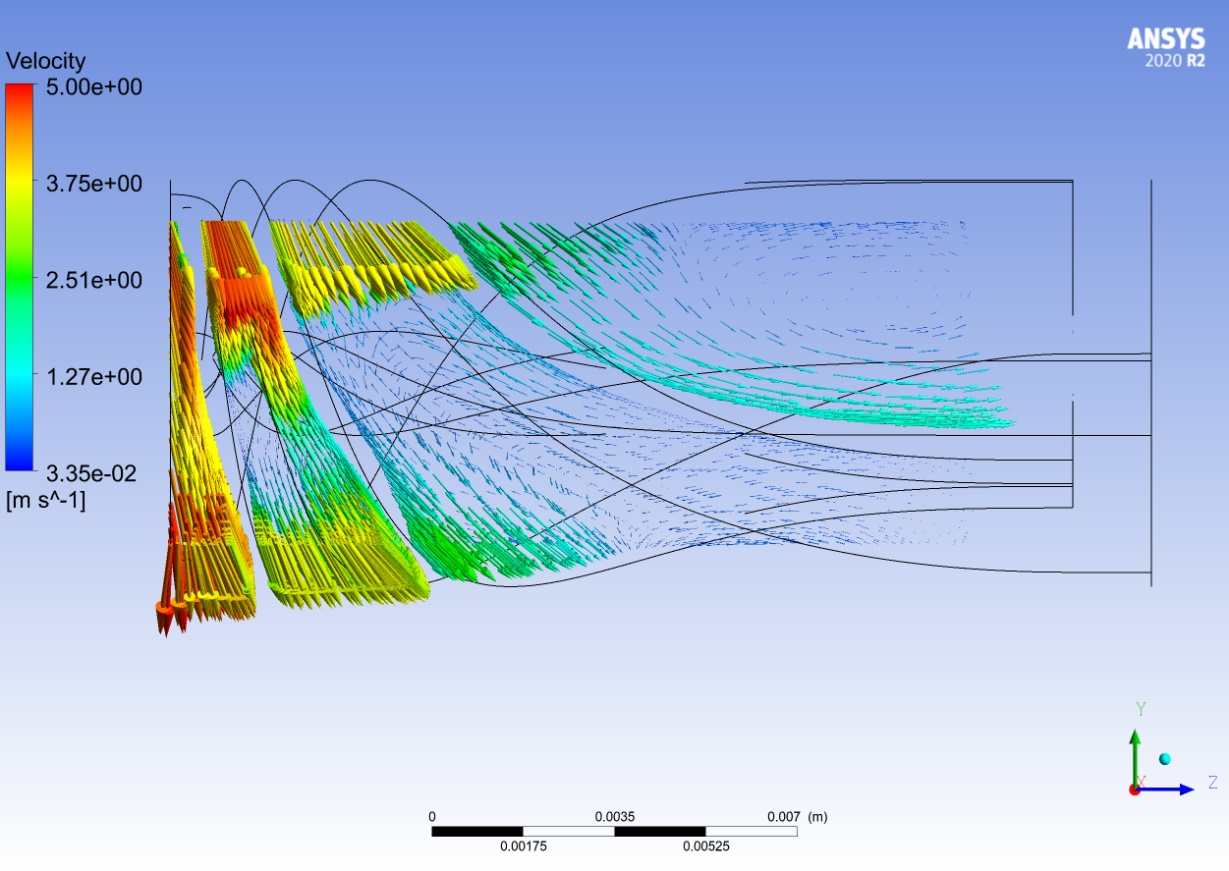 Velocity vector field for the diffuser from experiment 5 of the sensitivity analysis.
Design of Experiments
Based on this result, the impeller outlet angle and diffuser inlet lengths were set to have the highest level of refinement for the DoE. The number of levels indicates how many values of a certain parameter should be investigated.
The upper and lower bounds for each parameter were defined around the mean-line theory results and in line with the sensitivity analysis results.
| Parameter | Lower bound | Upper bound | Number of levels |
|---|---|---|---|
| β1 (degrees) | 4 | 35 | 12 |
| β2 (degrees) | 40 | 55 | 19 |
| α2 (degrees) | 4 | 35 | 16 |
| L1 (mm) | 5 | 18 | 14 |
| L2 (mm) | 5 | 18 | 18 |
Although all parameters were varied proportionally for the sensitivity analysis, it was noted that the impeller inlet angle had the highest absolute change, which may have contributed to the large change in pressure. Furthermore, the parameters are likely interdependent, and isolating each parameter would not give a robust indication of its effect on pressure. Therefore, the parameter bounds were relatively lenient, covering some values deemed inaccurate from the sensitivity analysis results.
A more detailed sensitivity analysis with more levels and analysis of changing multiple parameters simultaneously would be beneficial to help refine the DoE further. A total of 80 experiments were created using the DoE.
| Experiment number | β1 (degrees) | β2 (degrees) | α2 (degrees) | L1 (mm) | L2 (mm) |
|---|---|---|---|---|---|
| 1 | 15.3 | 50.0 | 26.7 | 9.0 | 18.0 |
| 2 | 20.9 | 50.8 | 6.1 | 14.0 | 11.1 |
| 3 | 26.5 | 47.5 | 14.3 | 8.0 | 16.5 |
| … | |||||
| 78 | 12.5 | 54.2 | 10.2 | 5.0 | 8.8 |
| 79 | 4.0 | 45.8 | 16.4 | 6.0 | 6.5 |
| 80 | 18.1 | 53.3 | 20.5 | 6.0 | 7.3 |