The Haemolysis Index Model was applied to the initial model.
Investigation of the blood haemolysis index revealed that in the impeller domain, HI’ was highest along the edges of the blade, and further downstream
These are the areas where the blood experienced the most shear stress and for the longest period of time. In this domain, the highest value of HI’ was 3.81e-4. This translates to a HI index of 5.49e-9.
In the diffuser domain, HI’ was highest at the inlet where the flow from the impeller hit the tip of the diffuser blade and along the blade itself
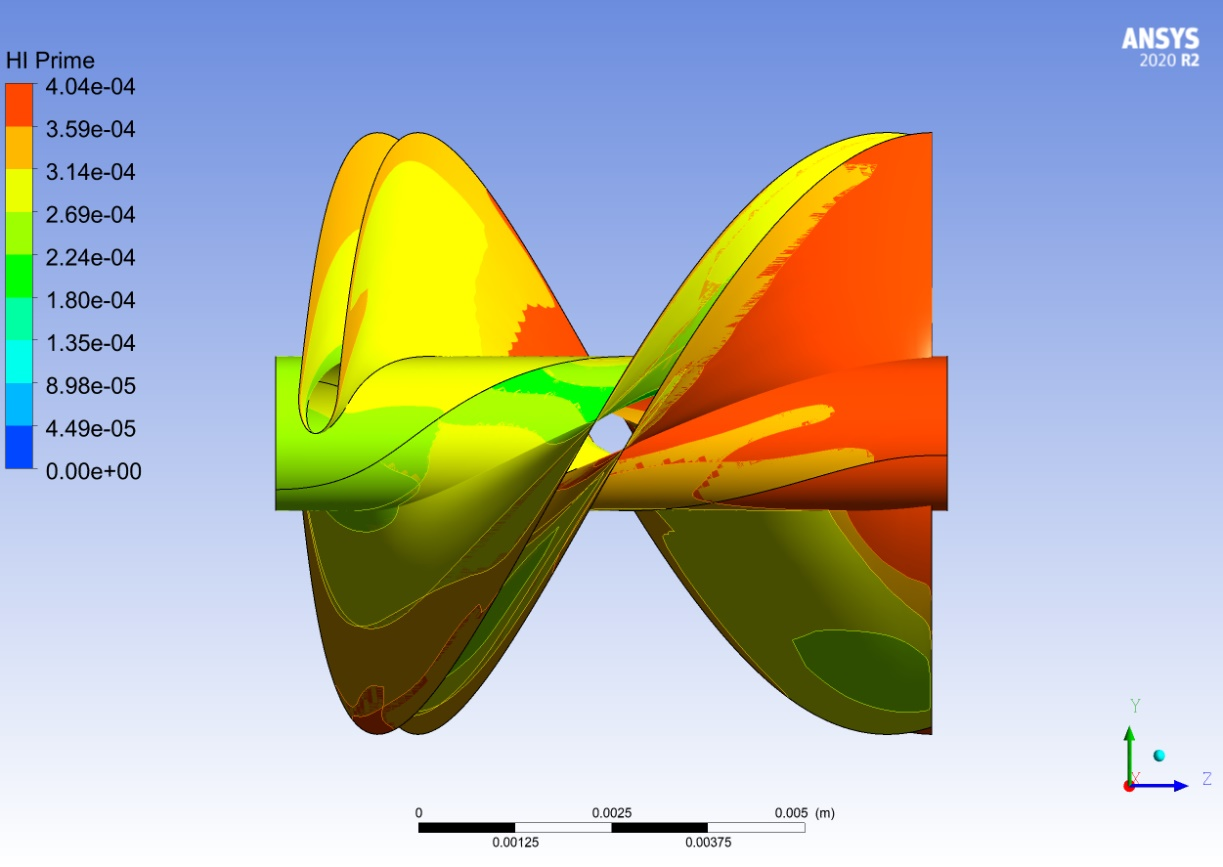 A contour plot of the HI’ values in the impeller domain.
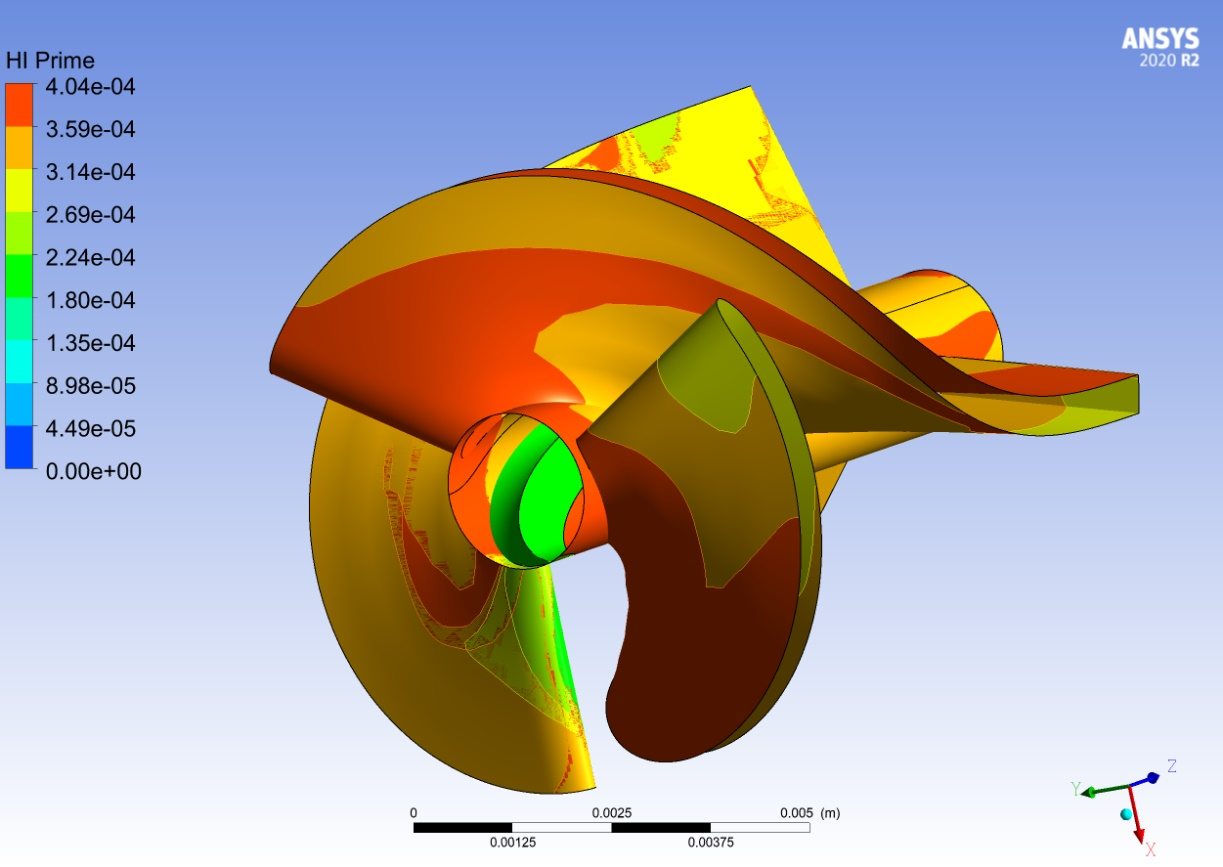 A contour plot of the HI’ values in the diffuser domain.
The highest value of HI overall was 6.32e-9. The HI values can be normalised to assess what physical effect this has on the blood (59).
In this case, the HI values were low, and the simulation would not predict haemolysis. The effect of haemolysis in the NeoVAD is largely affected by the washout impeller, which was not modelled as part of the project. Furthermore, the blood was modelled as a Newtonian fluid with constant viscosity. In reality, blood shows viscoelastic properties which may affect the shear stress and overall HI (60). Therefore, the implementation of the HI model was intended as a potential starting point for future development.